
IDM-16E1
IDM-16E1
The IDM-16E1 Digital Distribution Frame is a 16-group E1 full-switching device providing intelligent configuration, with power-off bypass function. It implements 16 groups of E1 channels with a simple single-board structure. The IDM-16E1 provides a network management interface, supports power-off bypass and power-off memory functions, and features comprehensive alarm monitoring, high integration, low power consumption, stable performance, and ease of use. The IDM-16E1 Digital Distribution Frame has complete alarm monitoring functions. Alarm contents include E1 signal loss and frame synchronization loss. In addition to reporting local alarm status, the remote alarm status can also be displayed via the local indicator lights through keypad operation. The power supply mode is selectable between ~220V and -48V. It adopts a dedicated large-scale integrated circuit and can provide transparent transmission of up to 16 groups of E1.
1. Overview
The IDM-16E1 Digital Distribution Frame is a 16-group E1 full-switching device providing intelligent configuration, with power-off bypass function. It implements 16 groups of E1 channels with a simple single-board structure. The IDM-16E1 provides a network management interface, supports power-off bypass and power-off memory functions, and features comprehensive alarm monitoring, high integration, low power consumption, stable performance, and ease of use.
The IDM-16E1 Digital Distribution Frame has complete alarm monitoring functions. Alarm contents include E1 signal loss and frame synchronization loss. In addition to reporting local alarm status, the remote alarm status can also be displayed via the local indicator lights through keypad operation. The power supply mode is selectable between ~220V and -48V.
2. Device Structure

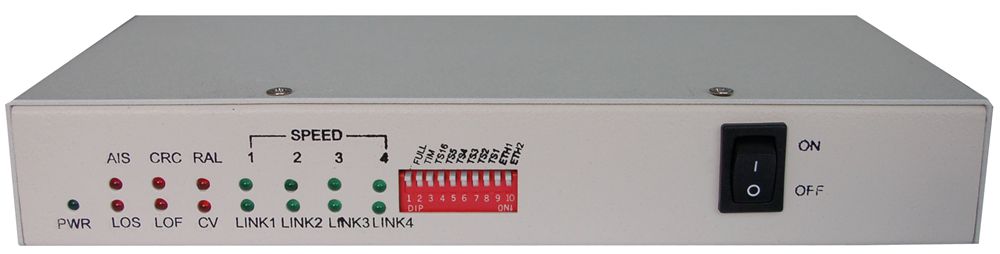
IDM-16E1 Digital Distribution Frame Front Panel Diagram

IDM-16E1 Digital Distribution Frame Rear Panel Diagram
3. Product Features
(1) Adopts a dedicated large-scale integrated circuit, providing transparent transmission of up to 16 groups of E1.
(2) Supports cascading of multiple devices via optical fiber. Two groups of optical fibers can also be used to form a ring network protection. Remote cross-connection, monitoring, testing, troubleshooting and other management functions for N*16 2M channels can be realized.
(3) Provides database management capability for maintenance and alarm records of the digital distribution frame. It can be connected to the computer room AI intelligent agent management system via MCP protocol, providing AI analysis reports and AI prediction reports.
(4) The E1 interface line code is HDB3. The E1 jitter tolerance, transfer characteristics, and output jitter fully comply with ITU-T G.703, G.823, and G.742 recommendations.
(5) Comprehensive monitoring and alarm functions. Provides line E1 signal loss and frame synchronization loss alarms. Panel indicator lights display specific alarm status; the device can also output alarm information. Monitored alarm contents include LOS, AIS, LOF, etc. Monitored error contents include CRC4, FAS, REI, etc.
(6) Supports E1 tributary remote loopback function, facilitating device testing and management.
(7) Provides Ethernet remote management capability, including monitoring, statistics, cross-connection, loopback, offline error testing, and latency testing.
(8) The whole unit adopts a single-board design in a standard 1U chassis.
(9) Power supply mode is selectable between ~220V AC or -48V DC, or with ~220V AC and -48V DC mutually redundant, providing 1+1 protection.
4. Supporting Management Platform
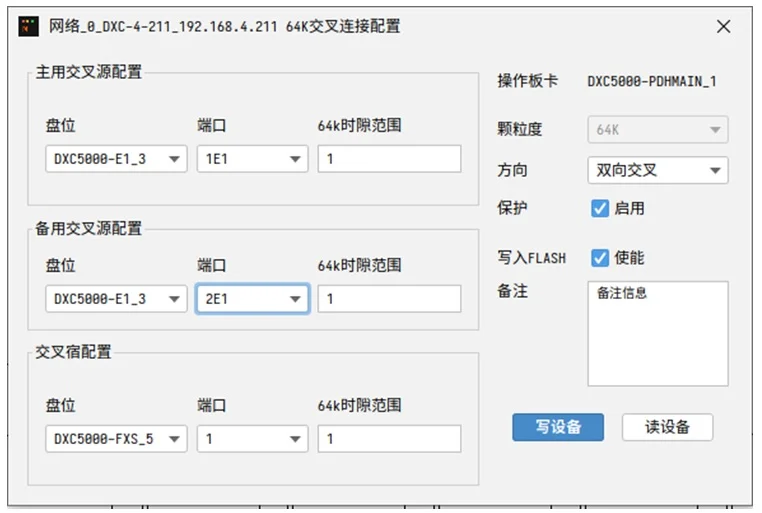
4.1 Network Management Platform Software
4.2 BI Visualization Display Software
Through visual elements such as graphics, charts, and maps, complex data in the E1 digital distribution frame system is transformed into intuitive, easy-to-understand dashboards.
- Global Status Overview Dashboard: Displays core KPIs such as total port count, number of normal/interrupted/warning ports, and availability rate.
- Real-time Performance Monitoring Dashboard: Displays real-time scrolling of transmit/receive optical power, error rate, and alarm status for each port in matrix or list form.
- Historical Report Dashboard: Generates daily/weekly/monthly reports, showing historical performance trends and statistical analysis results.
- Its characteristic is "people looking for information" — operations personnel need to proactively view these preset dashboards to obtain status information.
4.3 ChatBI Intelligent Agent
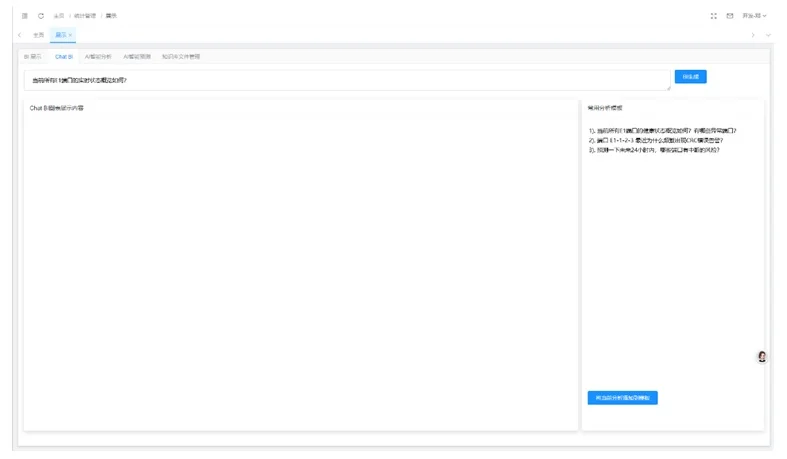
Allows operations personnel to ask questions directly in the most natural language, and the system directly returns answers or charts, rather than requiring users to search through complex dashboards.
Simply ask questions such as: "Which E1 port has the highest error rate today?" "Compare the availability of Port A and Port B last week." "What alarms does Port 12 in Rack 3 currently have?" The intelligent agent understands your intent, directly queries data from the backend database, and returns results in the most appropriate format (such as a sentence, a table, or a trend chart).
4.4 BI Intelligent Agent Analysis
A brain with proactive analysis capability. It helps you diagnose "why" problems occur through algorithms such as correlation analysis, pattern recognition, and machine learning.
- Correlation Analysis: Automatically analyzes whether an interruption of one port simultaneously affects other associated ports, quickly identifying whether it is a single-port issue, board issue, or upstream device issue.
- Pattern Recognition: Identifies patterns of performance degradation, such as "every time during peak business hours, the error rate of this port increases," pointing to possible congestion or interference issues.
- Multi-dimensional Drill-down: Drills down from aggregated data (such as a surge of network-wide alarms) to a specific computer room, rack, board, or even a single port, layer by layer to find the root cause.
- Its characteristic is "diagnosis and attribution" — from knowing what happened to knowing why it happened, it is the core of fault troubleshooting.
4.5 BI Intelligent Agent Prediction
Moving from post-hoc analysis to proactive prediction. Based on historical data, it uses models such as time series prediction and machine learning to predict potential future issues.
- Performance Trend Prediction: Predicts the development trend of the error rate of a specific E1 port over the coming days/weeks. If it predicts that the threshold will be exceeded, an early warning is issued in advance, enabling preventive maintenance and intervention before faults occur.
- Fault Risk Prediction: By analyzing degradation patterns of performance data (such as slow growth of CRC errors), combined with device lifecycle data, it predicts the probability and risk level of hardware failure for ports or boards, and generates a maintenance recommendation list to guide resource planning and spare parts preparation.
5. Interface Specifications and Technical Parameters
5.1 E1 Interface Specifications
- Line Code: HDB3
- Bit Rate: 2.048 kbit/s ± 50 ppm
- Impedance: 75Ω (unbalanced interface) / 120Ω (balanced interface)
5.2 Power Supply
- AC 220V (165-260V), 50Hz
- DC: -48V, 1A
5.3 Operating Environment
- Temperature: 0ºC ~ 45ºC
- Humidity: 90% (non-condensing)
5.4 Storage Temperature
- Storage Temperature: -20 ~ 70℃
5.5 Total Power Consumption
- Total Power Consumption: <15W
5.6 Device Specifications
- Dimensions: 19-inch 1U / desktop
FAQs
What is the working principle and function of a media converter?
The rapid advancement of informatization has led to growing demand for multimedia communications such as data, voice…
View answerWhat is the difference between optical fiber and optical cable? What are the common optical fiber connectors?
Optical fiber is a medium that transmits information from one end to another. It is a glass or plastic fiber that…
View answer